(If you’re only looking for the code, click here)
A couple of months ago, I had the pleasure of proof-reading the BA thesis of a friend of mine (who wants to remain pseudo-anonymous). While I still remember maintaining my BA thesis in a very messy folder including sins like spaces in file names (shocking!), they 1 had just granted me access to a private GitHub repository. The kids nowadays are so advanced! #impressed
Anyway, recently we were joking around about this and I remembered that I had always wanted to look into the Git history of this repository, more specifically into the commit messages…for serious research purposes of course! My goal was to create a wordcloud of the messages because… well, our conversation is basically just a constant stream of shitposting and wordclouds are probably one of the shittiest types of data visualization - at least in my opinion.2
Turns out it is super easy to create such a wordcloud in R. Here are the 12 lines of code (excl. library statements and comments) that you’ll need to create your own (commits are from my own blog repository).
Code
# get commit list, remove commits made by git and extract data frame
commits <- git2r::commits()
commits_df <- tibble::tibble(message = purrr::map_chr(commits, "message")) %>%
  dplyr::filter(!stringr::str_detect(message, "^Merge branch|Merge remote|Merge pull|Auto stash"))

# parse tokens and remove stopwords
commit_words <- commits_df %>%
  tidytext::unnest_tokens(word, message) %>%
  dplyr::count(word, sort = TRUE) %>%
  dplyr::anti_join(stop_words, by = "word") # remove stopwords

# plot!
set.seed(7353) # fun fact: german "calculator word" for donkey (Esel)
ggplot(commit_words, aes(label = word, size = n)) +
  geom_text_wordcloud(area_corr_power = 1) +
  scale_size_area(max_size = 12) +
  theme_minimal()
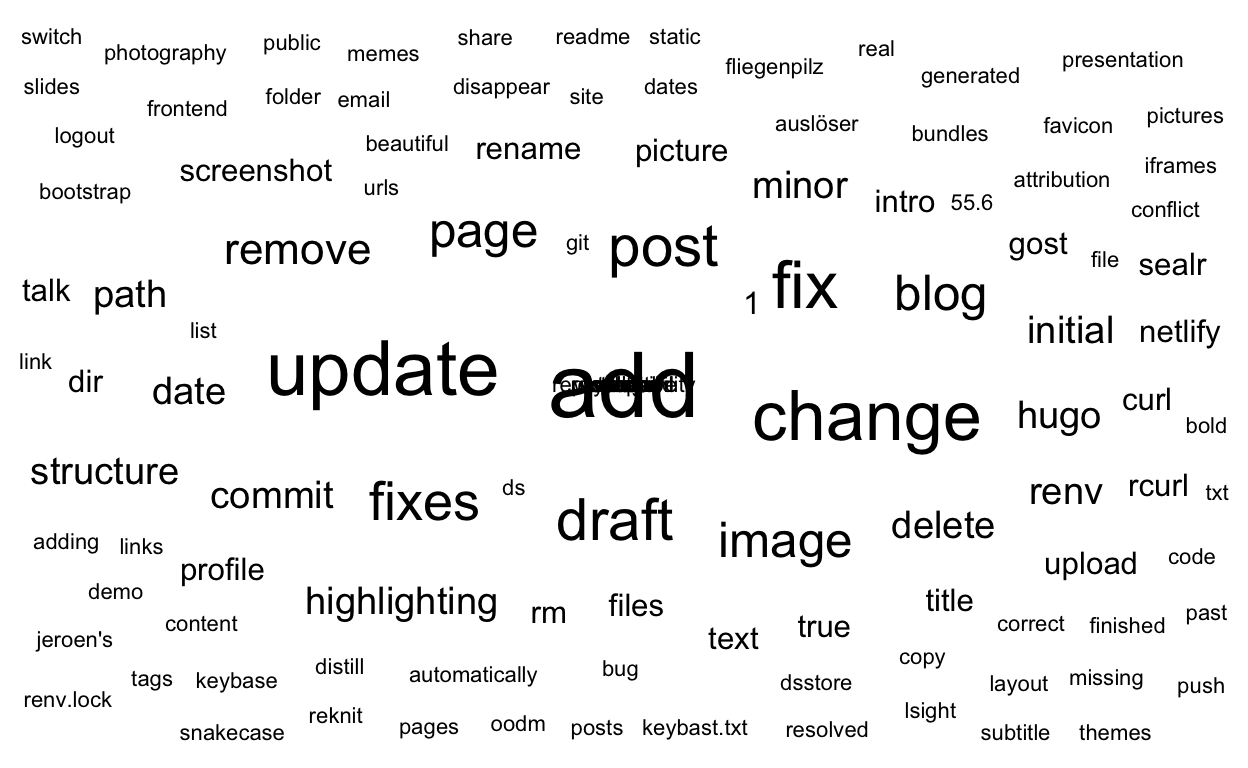
No surprises here: I add, I update, I fix, I draft, I delete, and I change. Involved entities are typically: images, posts, pages, the blog (say what), structure (needed!) and highlighting (something I still haven’t figured out - help me! 😭).
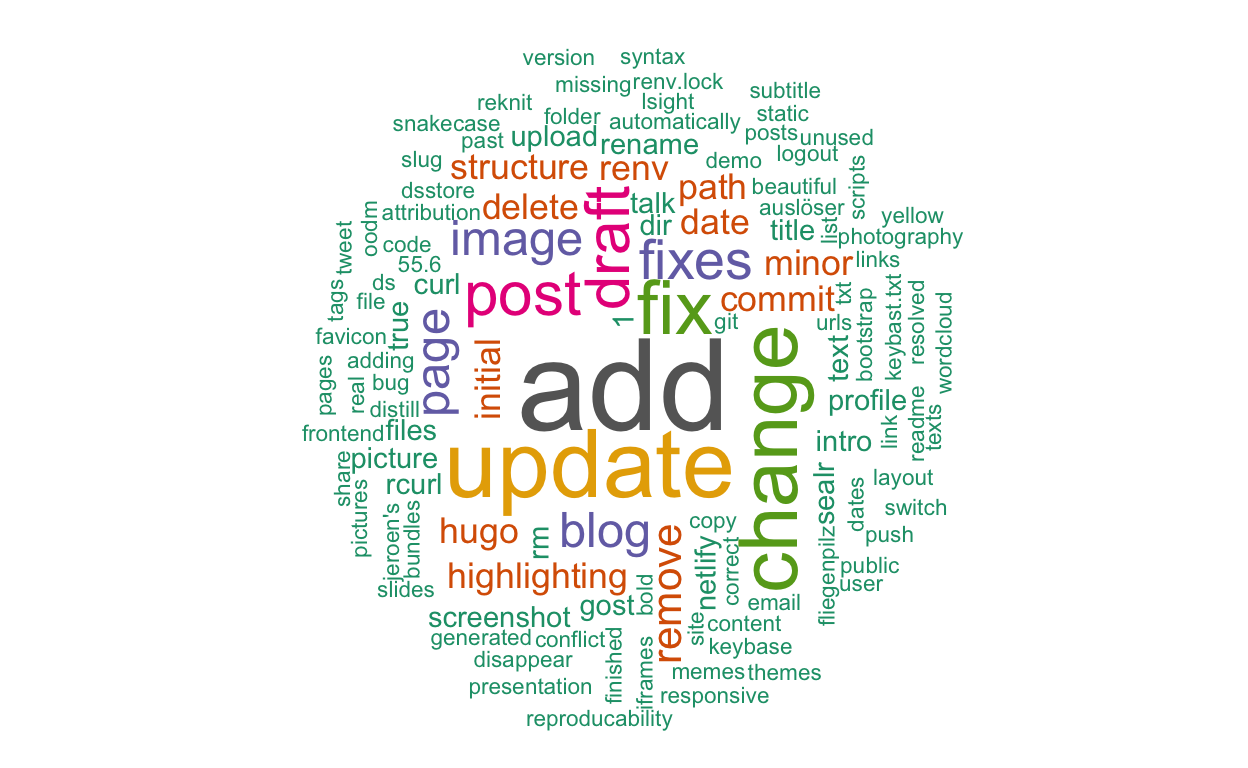
Bonus: a version with meaningless colors and vertical text so that you have to move your stiff neck (why wordclouds? whyy):
library(wordcloud)
wordcloud(words = commit_words$word, freq = commit_words$n, min.freq = 1, max.words = 200, random.order = FALSE, rot.per = 0.35, colors = brewer.pal(8, "Dark2"))
End
I just want to say that - as almost every model, tool, or data visualization technique (yes, even pie charts imo!) - wordclouds definitely have a place in the data science world. I just have a personal dislike for them. If you like to use them extensively throughout your work, please do so - you do you and I am sure they look great! :)
There was literally no point to this post besides sharing the code with you all in case you want to laugh at your commit messages. I’ll be back next time with (hopefully) more meaningful content.
Until then: keep coding.❤️
singular they is grammatically correct! see e.g. Merriam-Webster.↩︎
I think they probably have value in that they can be a good eyecatcher but in terms of how well and accurate information is represented typically…not a fan! If you disagree, let me know!↩︎